PowerBI-Projects
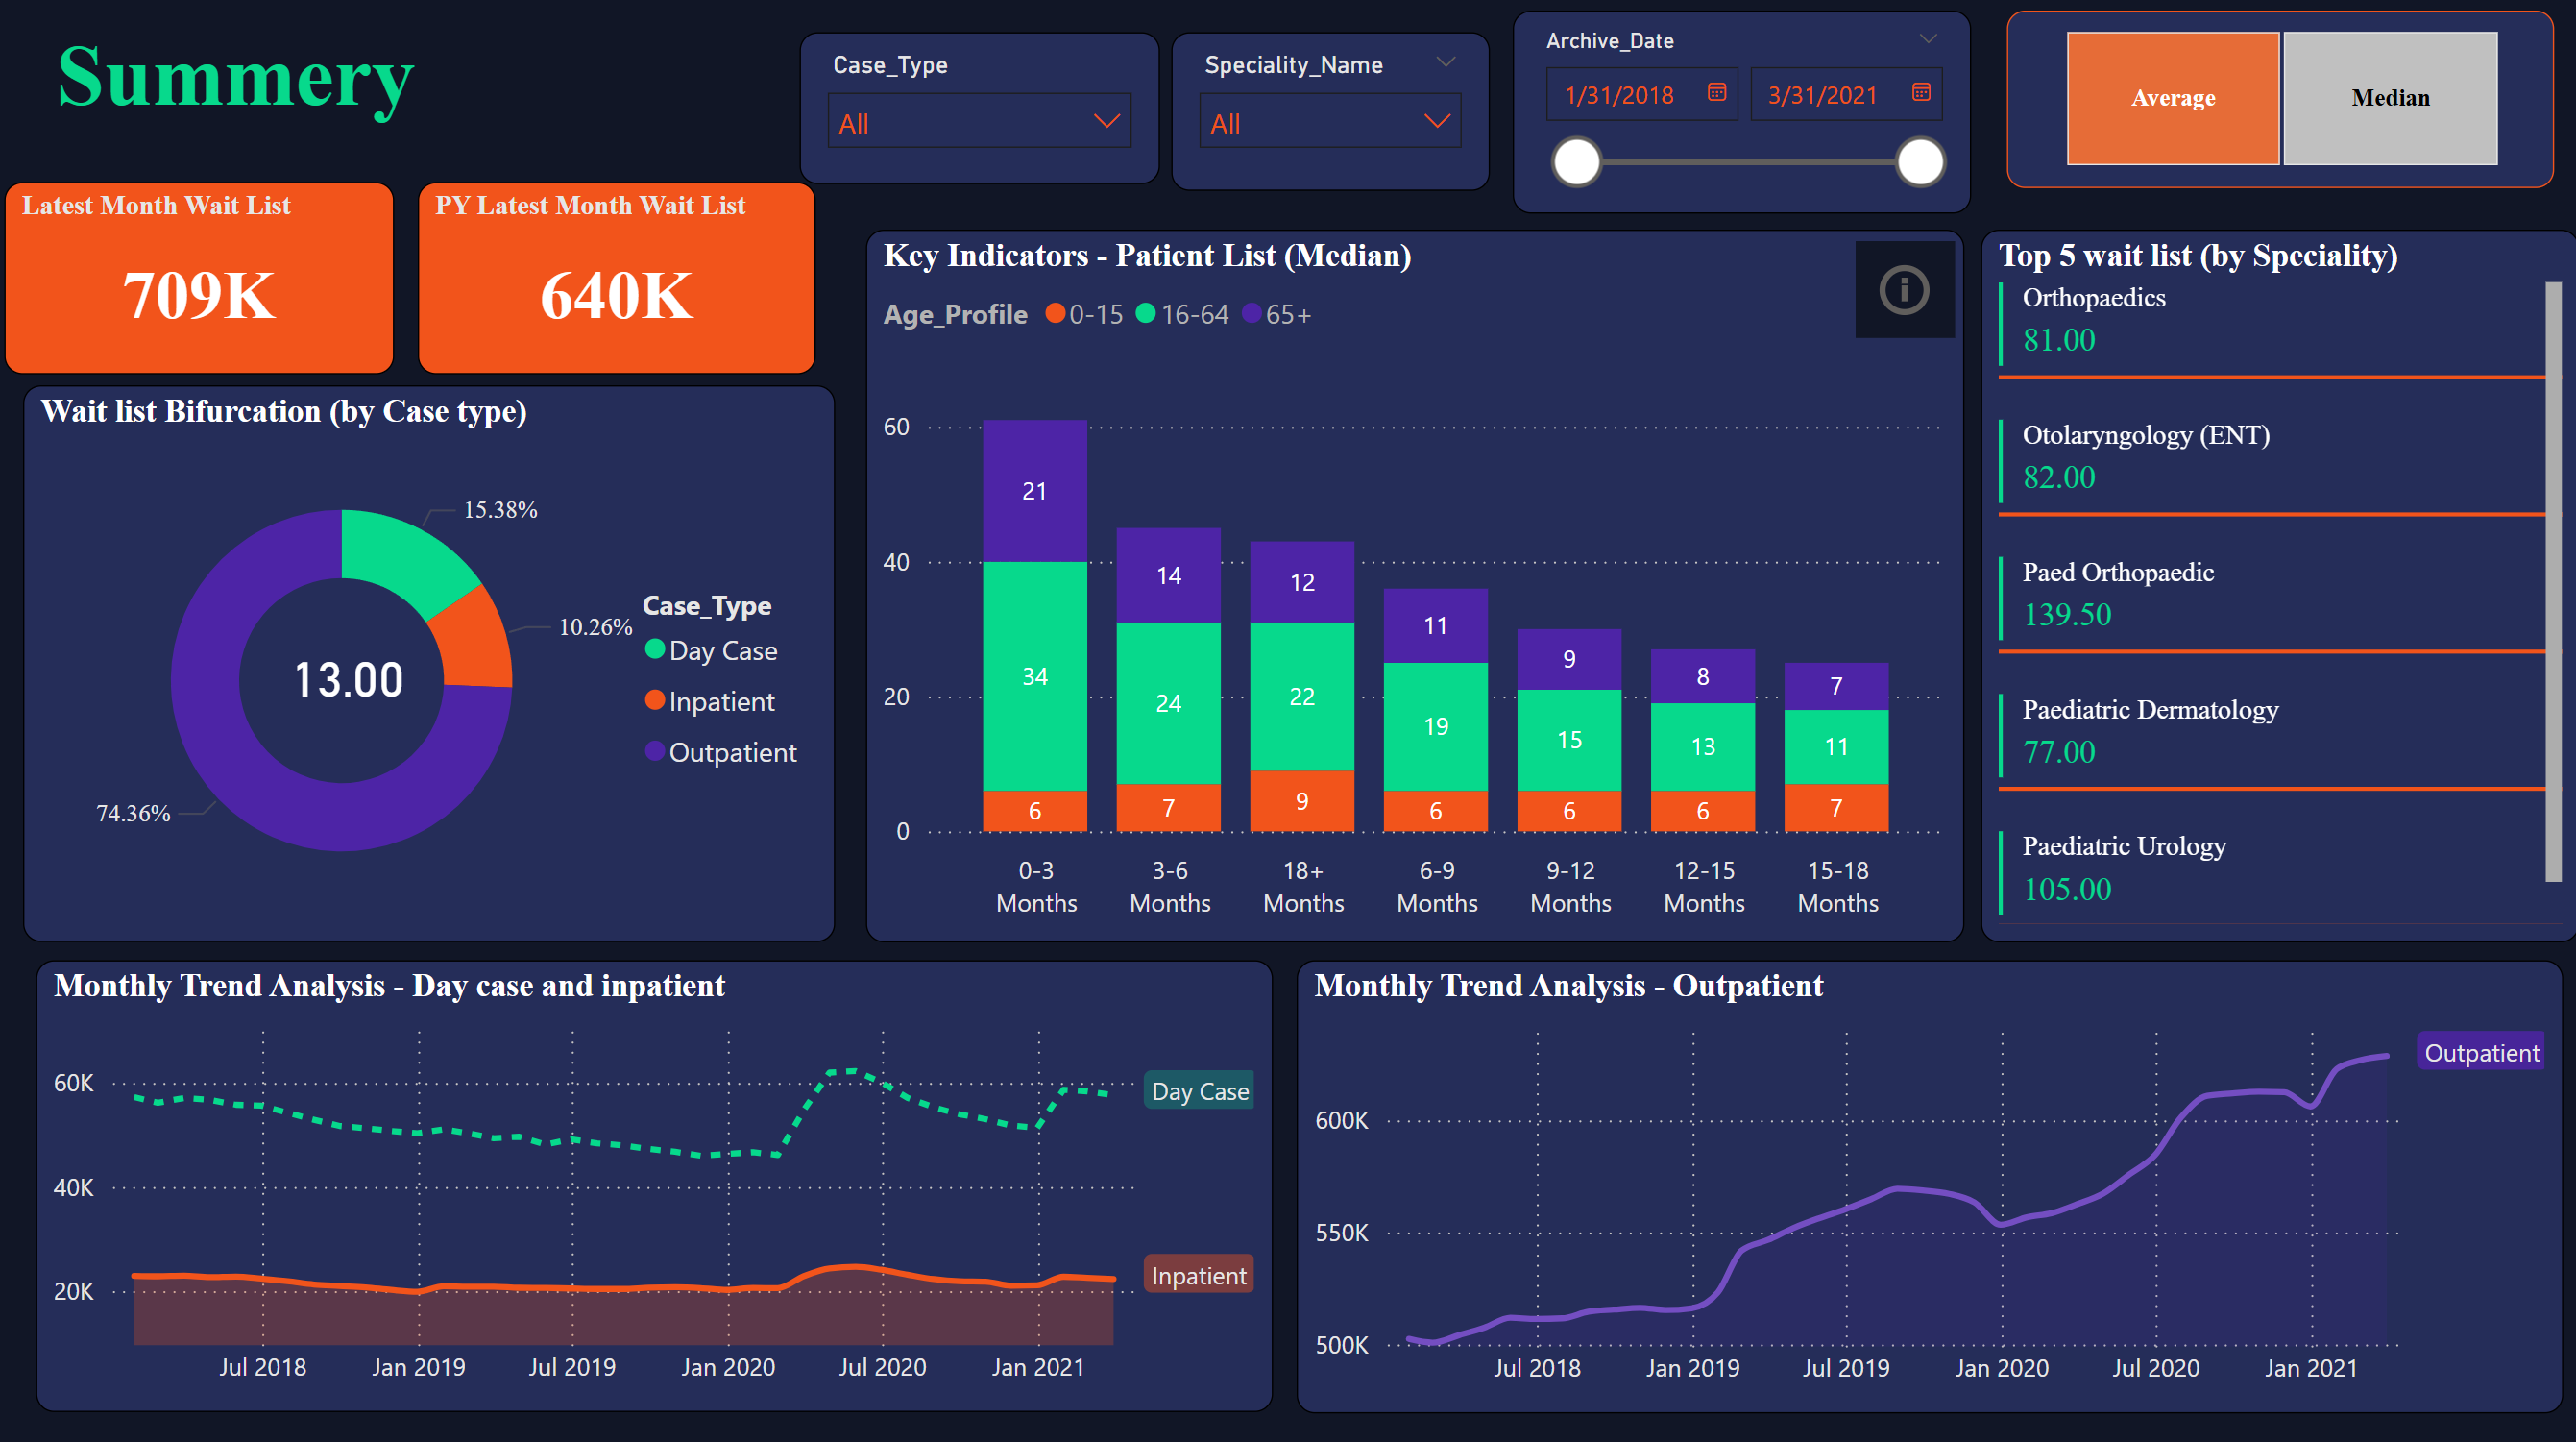
Healthcare Data—Patient wait list Dashboard
Project Goals
-
Track the current status of the patient waiting list
-
Analyze the historical monthly trend of waiting in the inpatient and outpatient categories
-
Detailed specialty level and age profile analysis
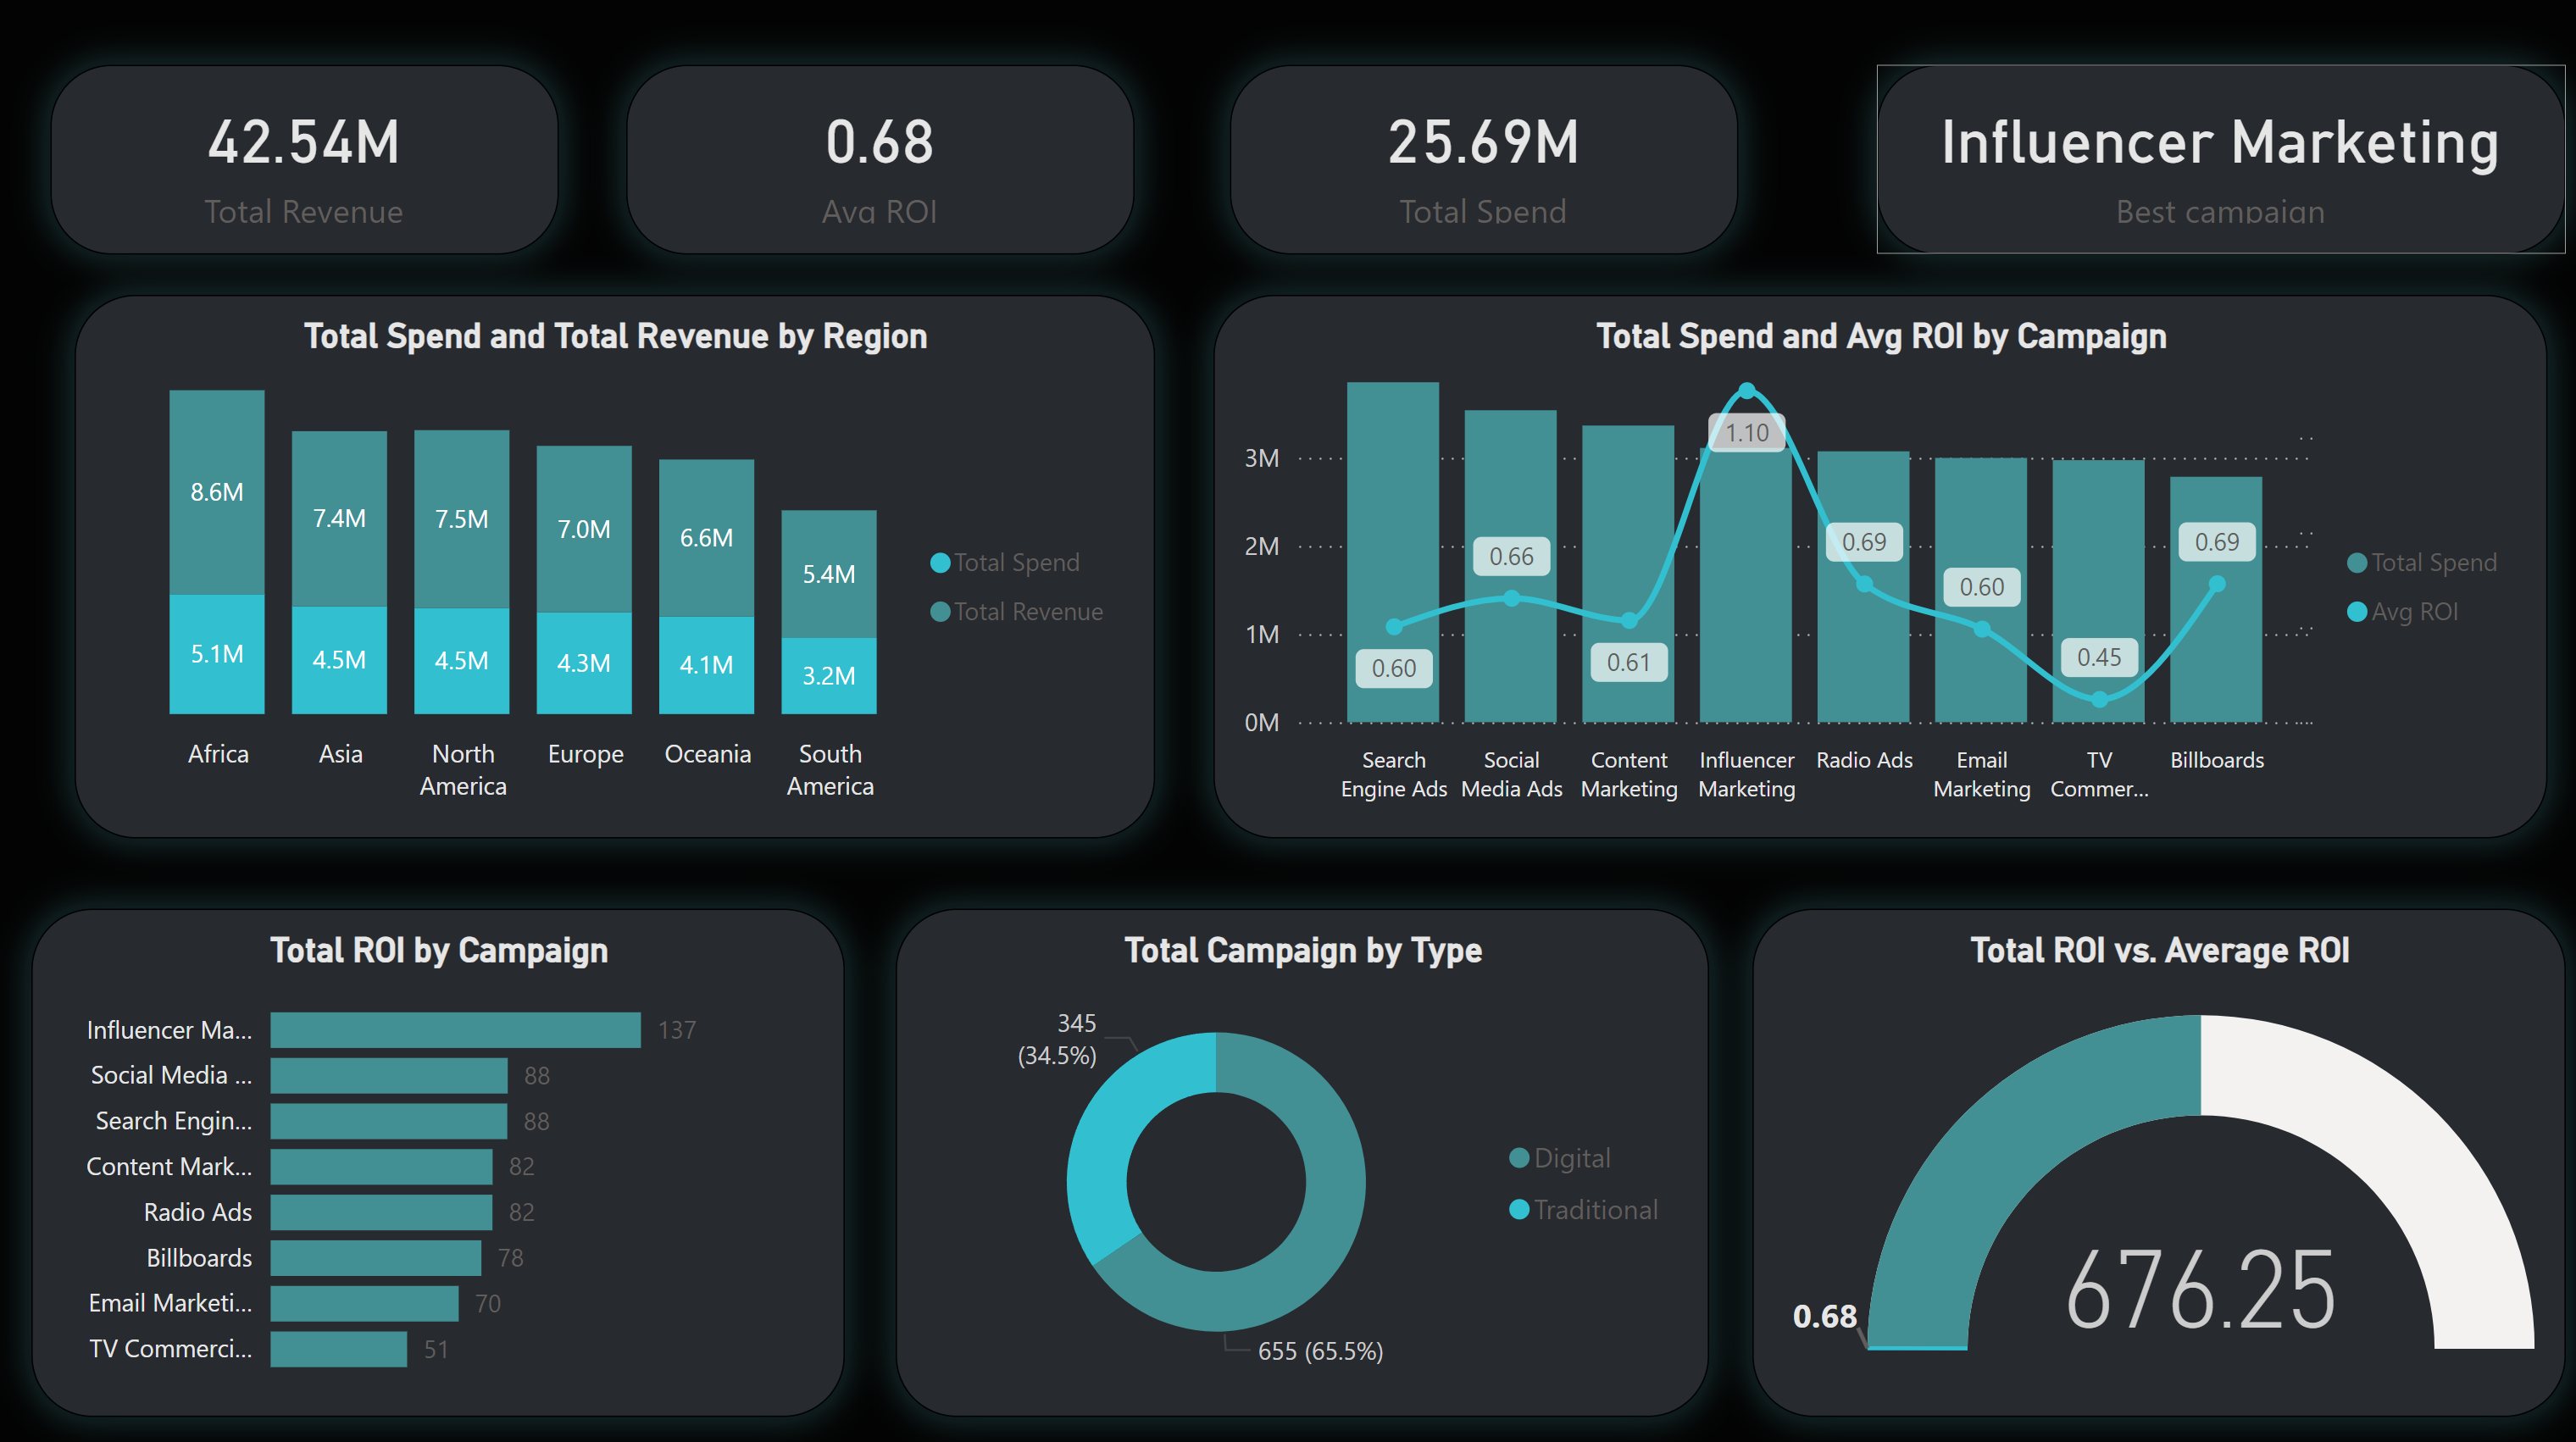
Marketing Campaign Performance Dashboard
Influencer Marketing Campaign Insights
This project analyzes the performance of an influencer marketing campaign, highlighting key metrics, regional performance, and actionable insights. Below is a summary of the findings.
Key Metrics
- Total Revenue: $42.54M
- Total Spend: $25.69M
- Average ROI: 0.68
Regional Performance
The campaign’s performance varied across regions, with Africa emerging as the top-performing region.
| Region | Total Spend | Total Revenue |
|---|---|---|
| Africa | $8.6M | $7.4M |
| Asia | $7.5M | $7.0M |
| North America | $7.0M | $6.6M |
| Europe | $6.6M | $5.1M |
| Oceania | $5.1M | $4.5M |
| South America | $4.5M | $4.1M |
Campaign Performance
The Influencer Marketing campaign was the best-performing initiative, delivering the highest ROI.
- Influencer Marketing ROI: 0.68
- Other campaigns showed consistent performance, with ROIs ranging between 0.60 and 0.68.
Key Insights
- Regional Focus: Africa demonstrated strong potential, making it a key region for future investments.
- Influencer Impact: Leveraging trusted voices through influencer marketing drove significant engagement and revenue.
- ROI Consistency: While the ROI was consistent across campaigns, there’s room for optimization to achieve even higher returns.
Conclusion
This analysis highlights the effectiveness of influencer marketing and the importance of regional strategies in maximizing ROI. By focusing on high-performing regions and innovative campaigns, brands can unlock greater growth opportunities.
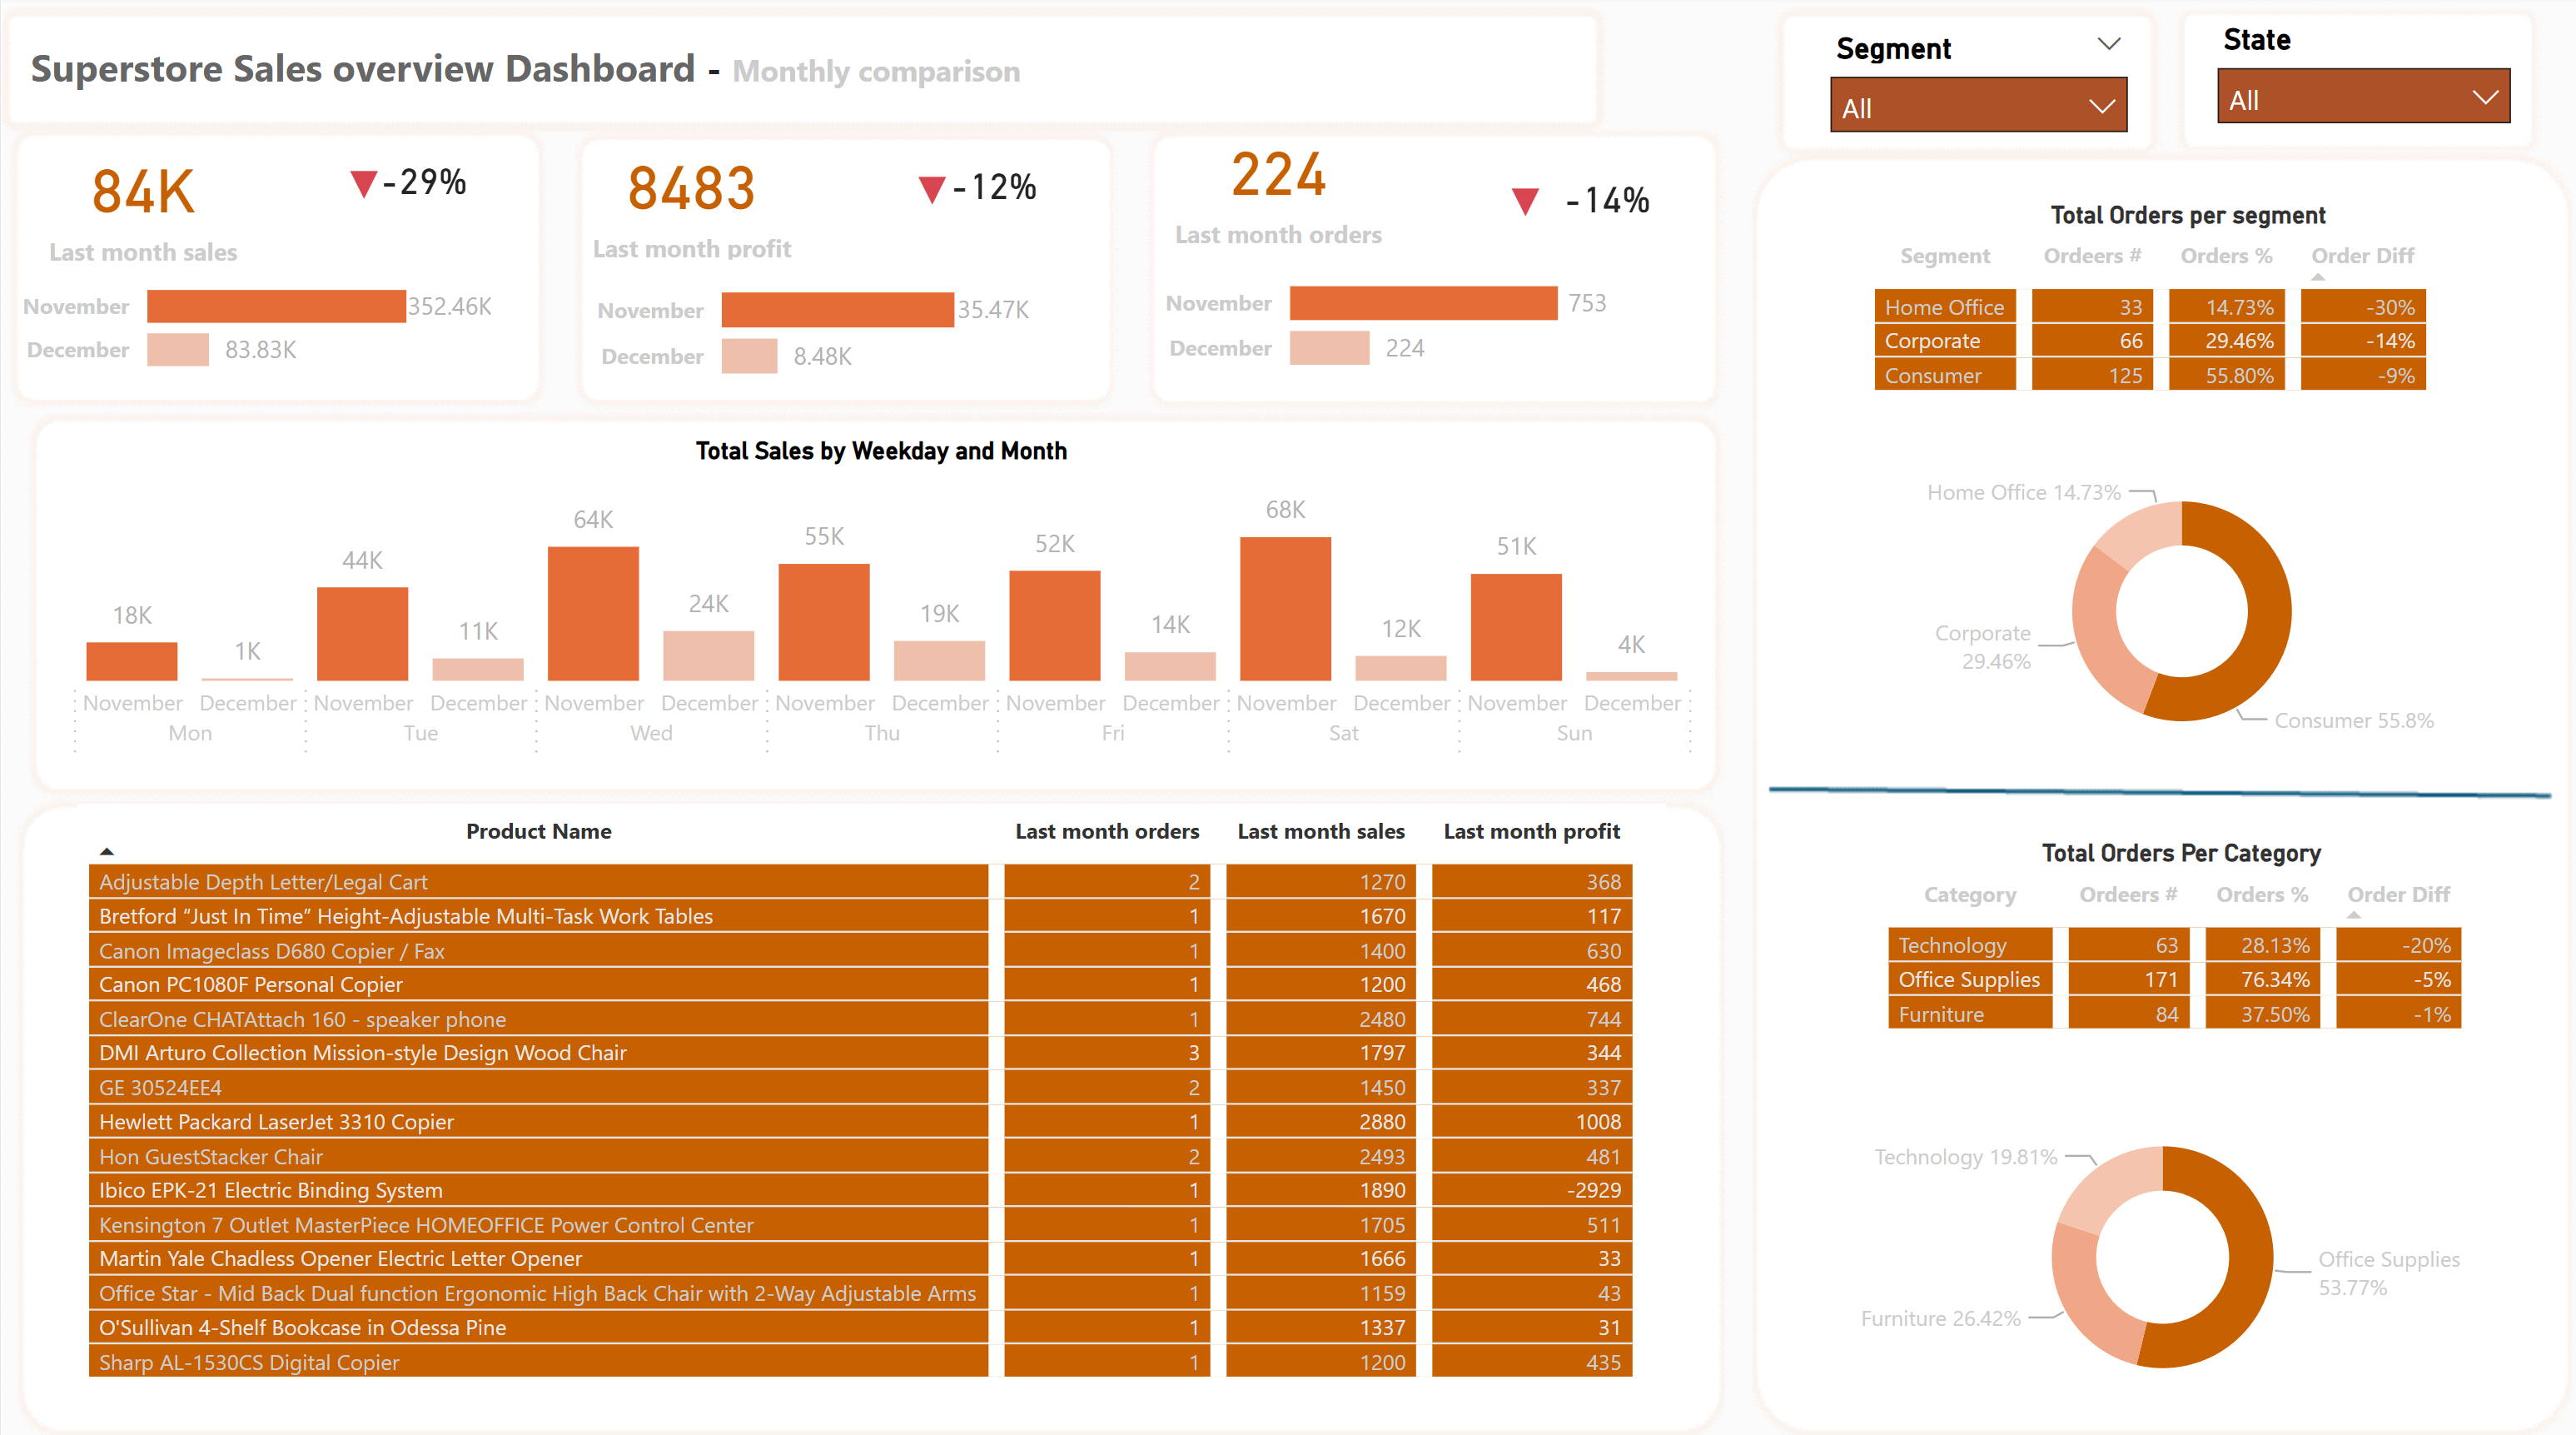
Superstore Sales overview Dashboard - Monthly comparison
Superstore Sales Drop – Analyzing the Decline & Finding Solutions
Looking at this Superstore Sales Overview Dashboard, one thing is clear: December’s performance took a major hit compared to November.
🔎 Key Findings:
- ❌ Sales dropped by 29% (from 352.46K to 83.83K).
- ❌ Profit declined by 12% (from 35.47K to 8.48K).
- ❌ Total orders fell by 14% (from 753 to 224).
🛑 What’s causing the drop?
📌 Orders are down across all segments:
- Home Office (-30%)
- Corporate (-14%)
- Consumer (-9%)
📌 Technology sales declined the most (-20%), followed by:
- Office Supplies (-5%)
- Furniture (-1%)
📌 Profitability concerns:
- Some products, like the Ibico EPX-21 Electric Binding System, are selling at a loss (-2929).
- Discounts or pricing issues may be hurting margins.
💡 How to Fix It?
✅ Strategic Promotions: Offer targeted discounts on high-margin products.
✅ Inventory Check: Ensure best-selling products are in stock.
✅ Improve Marketing: Increase engagement via email, ads & social media.
✅ Reassess Pricing: Adjust pricing strategies to avoid selling at a loss.
✅ Competitor Analysis: Stay competitive with pricing & offers.
📊 The lesson?
Regularly analyzing sales data helps identify issues early and take action to prevent revenue loss.
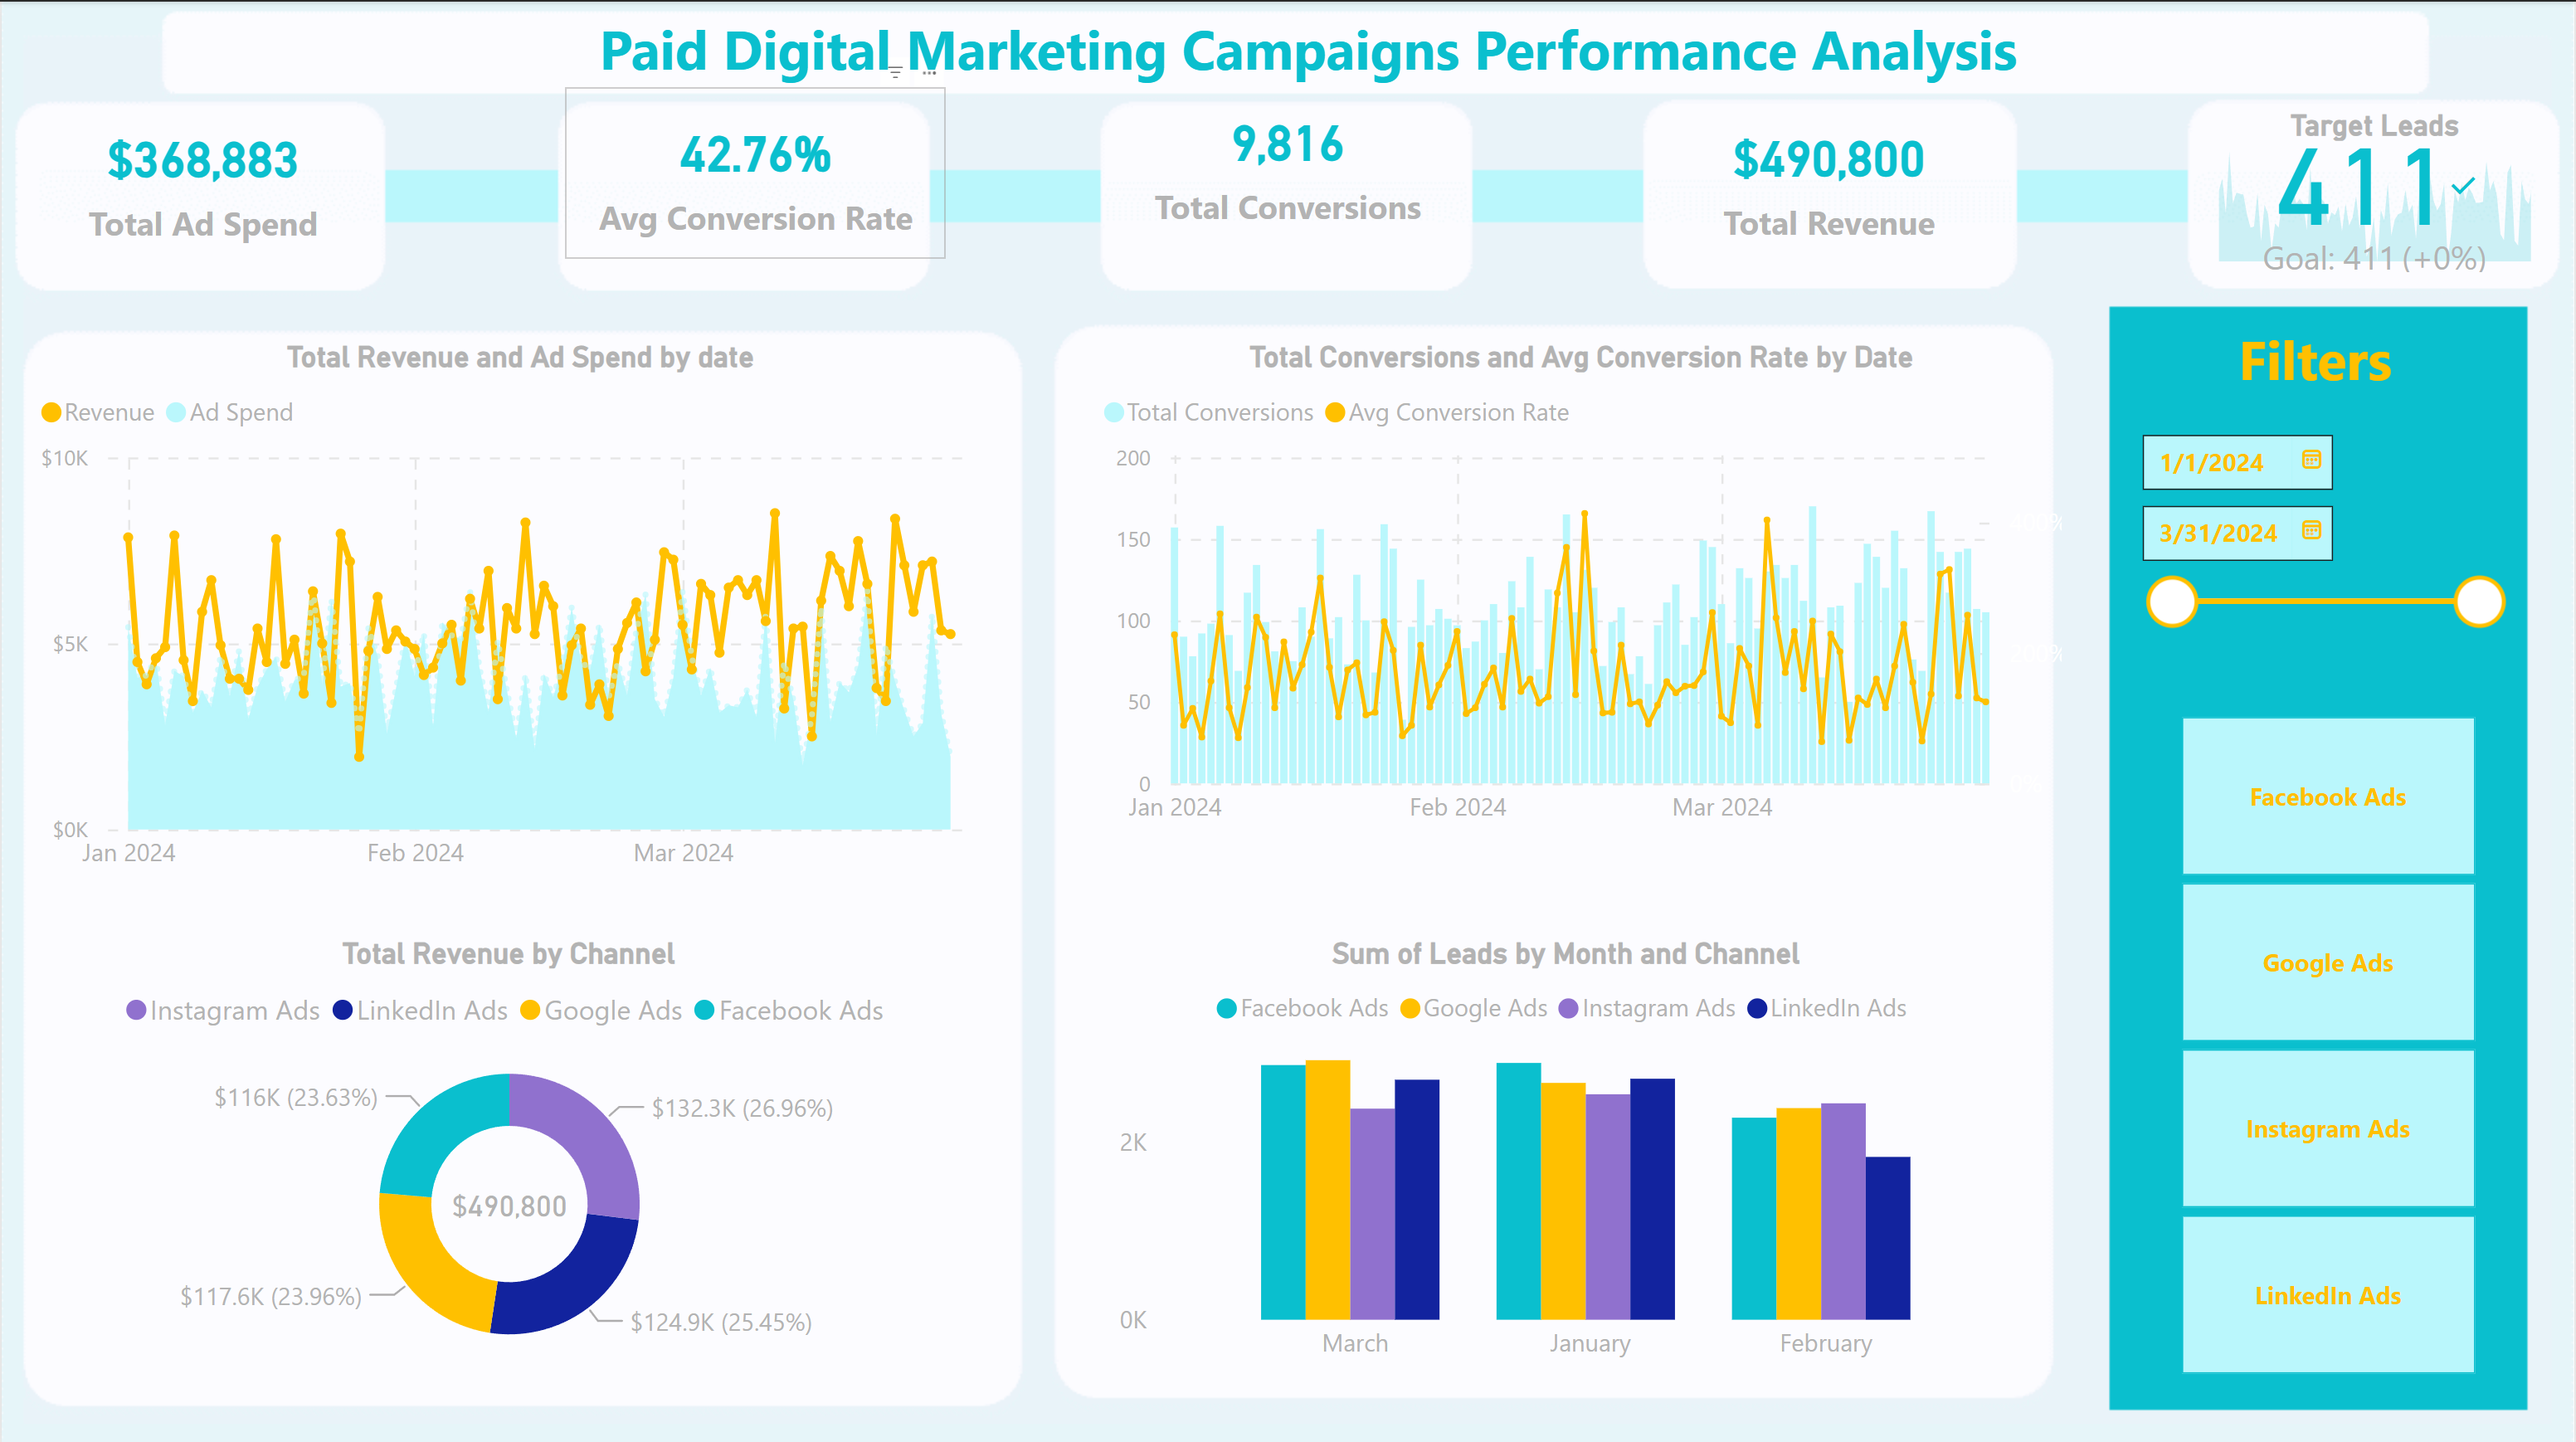
Paid Digital Marketing Campaigns Performance Analysis
Use Case & Benefits:
✅ Helps marketing teams track ad performance and budget efficiency.
✅ Enables data-driven decision-making for optimizing digital marketing strategies.
✅ Identifies high-performing ad channels and areas for improvement.
This Power BI dashboard provides a powerful, interactive way to analyze and enhance digital marketing campaigns. 🚀
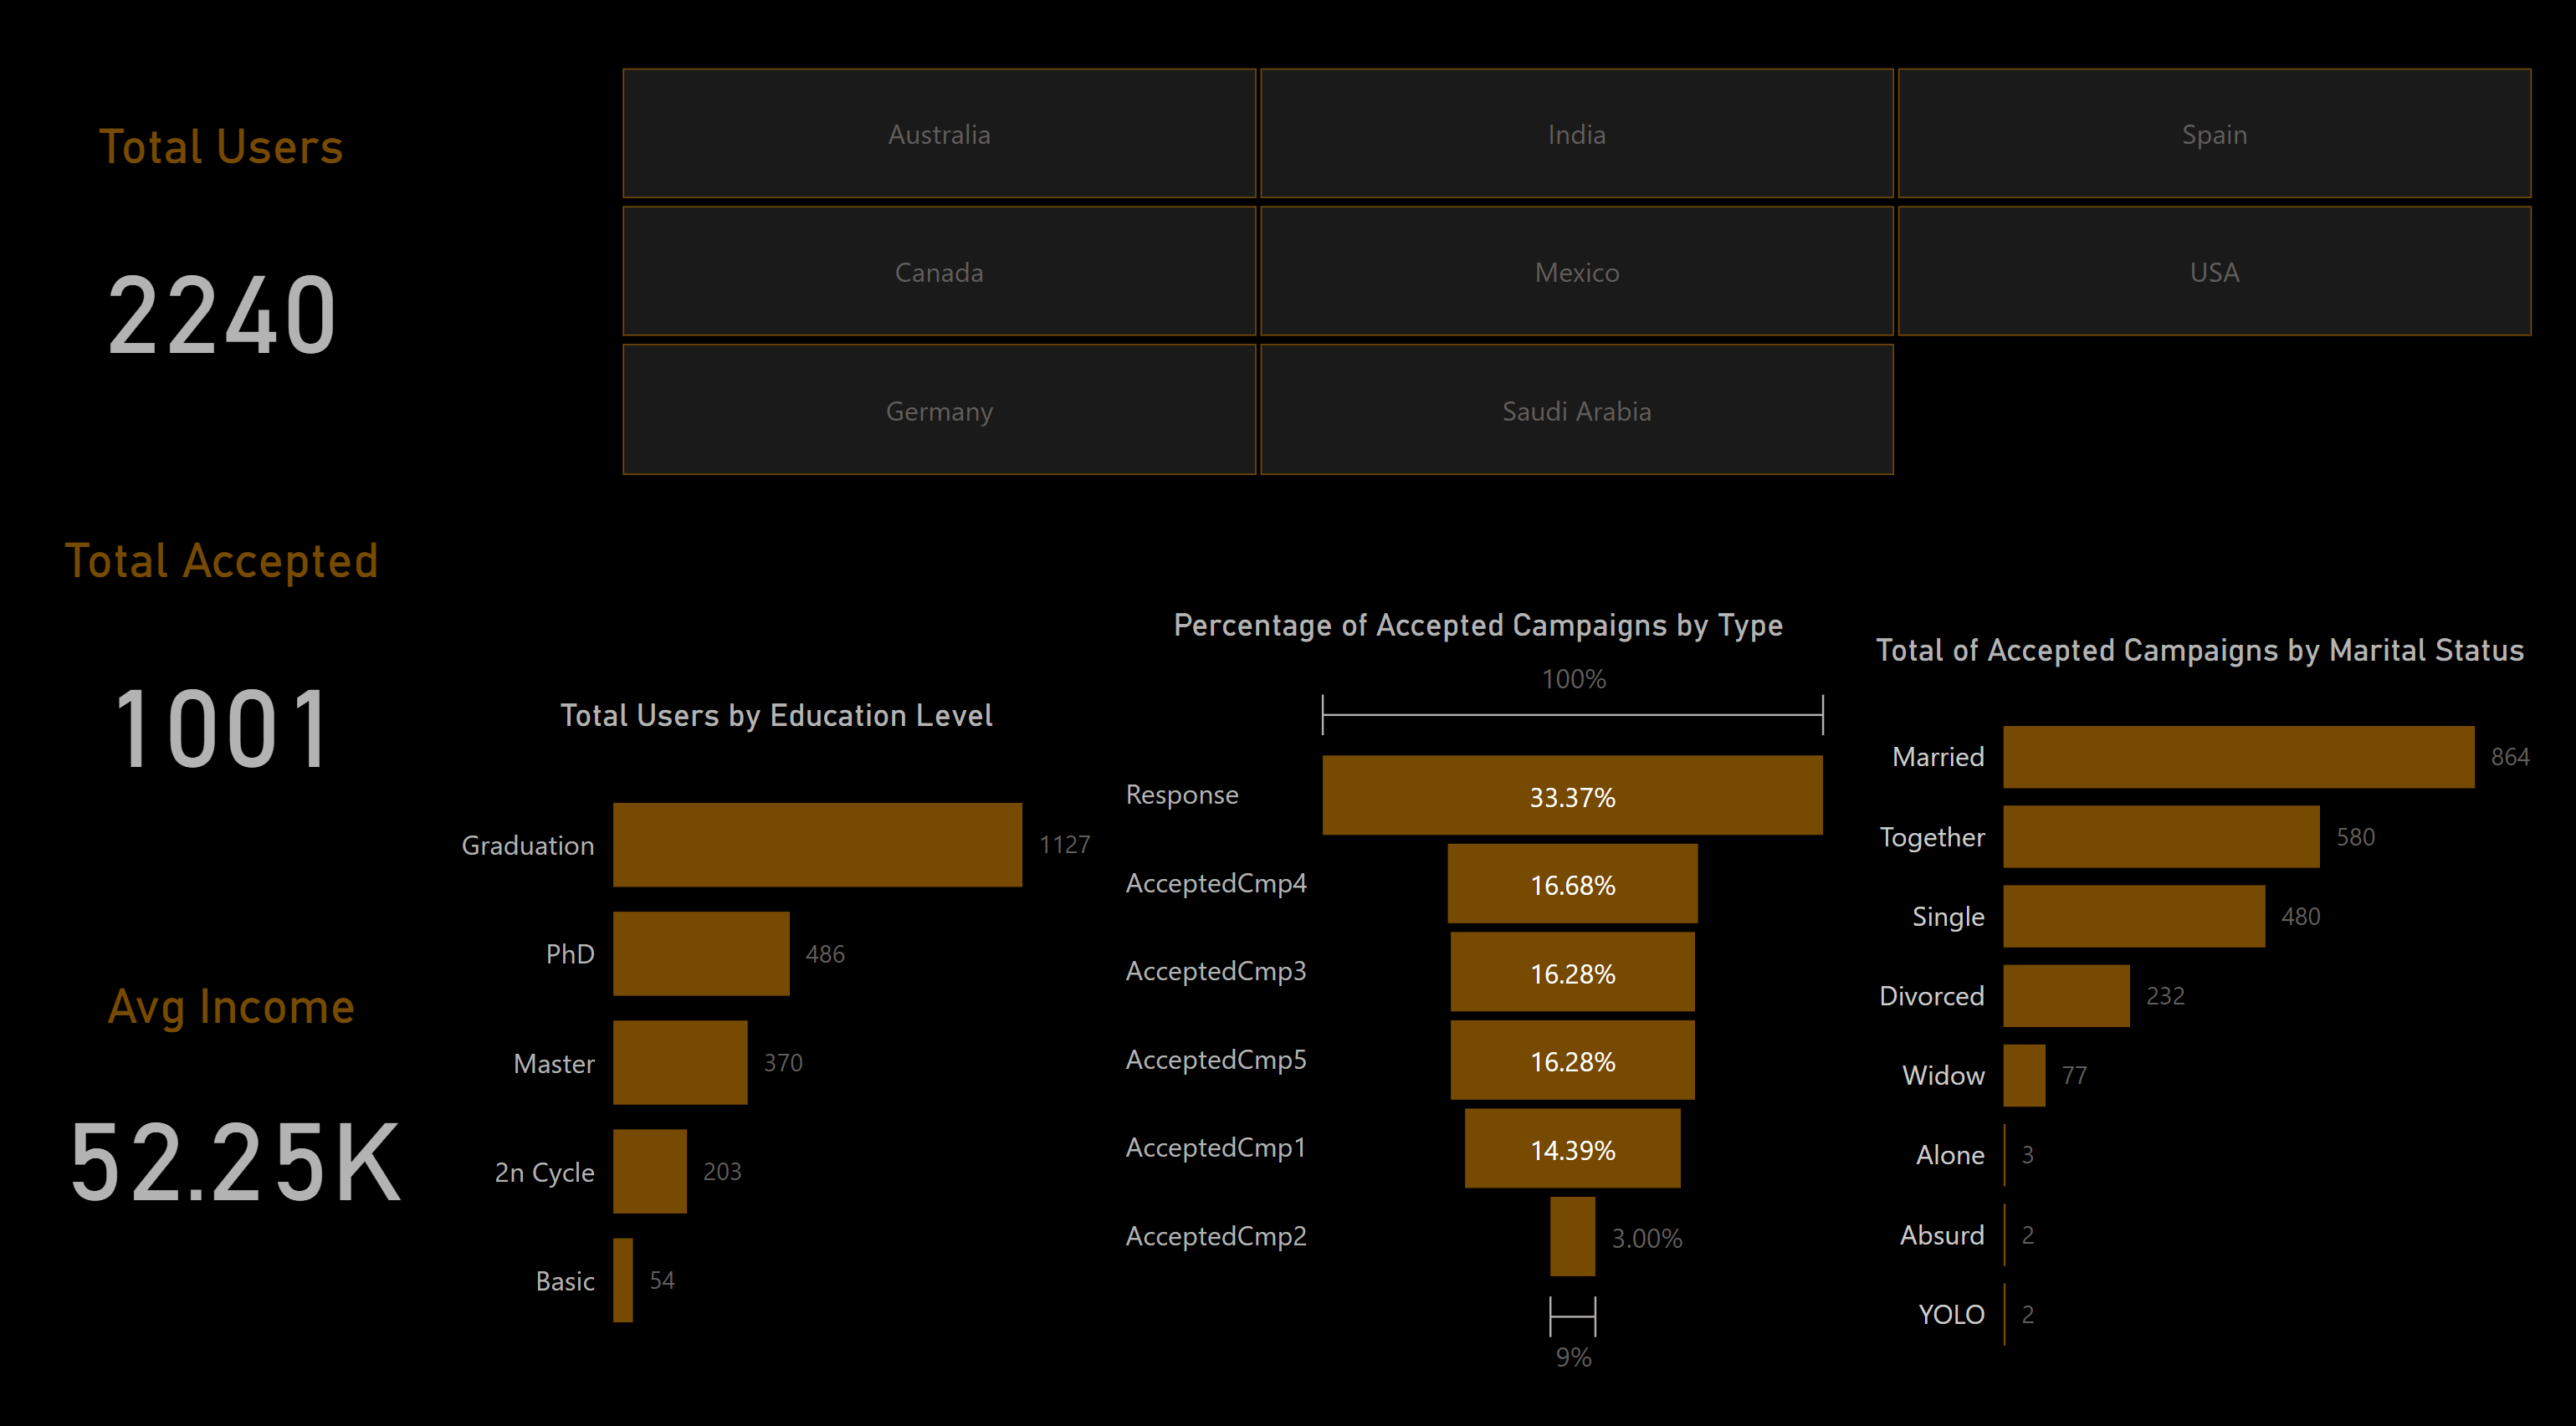
User Campaign Acceptance Insights
This document provides insights into user demographics and campaign acceptance rates based on the provided data.
Total Users
- Total Users: 52.25K
User Distribution by Country
Total Accepted Campaigns
- Total Accepted Campaigns: 1,001
Percentage of Accepted Campaigns by Type
- AcceptedCmp4: 16.68%
- AcceptedCmp3: 16.28%
- AcceptedCmp5: 16.28%
- AcceptedCmp1: 14.39%
- AcceptedCmp2: 3.00%
Total Accepted Campaigns by Marital Status
- Married: 654
- Together: 560
- Single: 480
- Divorced: 222
- Widow: 77
- Alone: 3
- Absurd: 2
Total Users by Education Level
- Graduation: 1,127
- PhD: 486
- Master: 370
- 2n Cycle: 203
- Basic: 54
- YOLO: 2
Response Rate
- Response Rate: 33.37%
Insights
- The highest number of accepted campaigns is from married users (654).
- Graduation-level educated users form the largest group (1,127).
- The response rate for campaigns is 33.37%, indicating a moderate level of engagement.
- AcceptedCmp4 has the highest acceptance rate among campaign types at 16.68%.
This data can help in understanding user engagement and tailoring future campaigns to specific demographics for better acceptance rates.
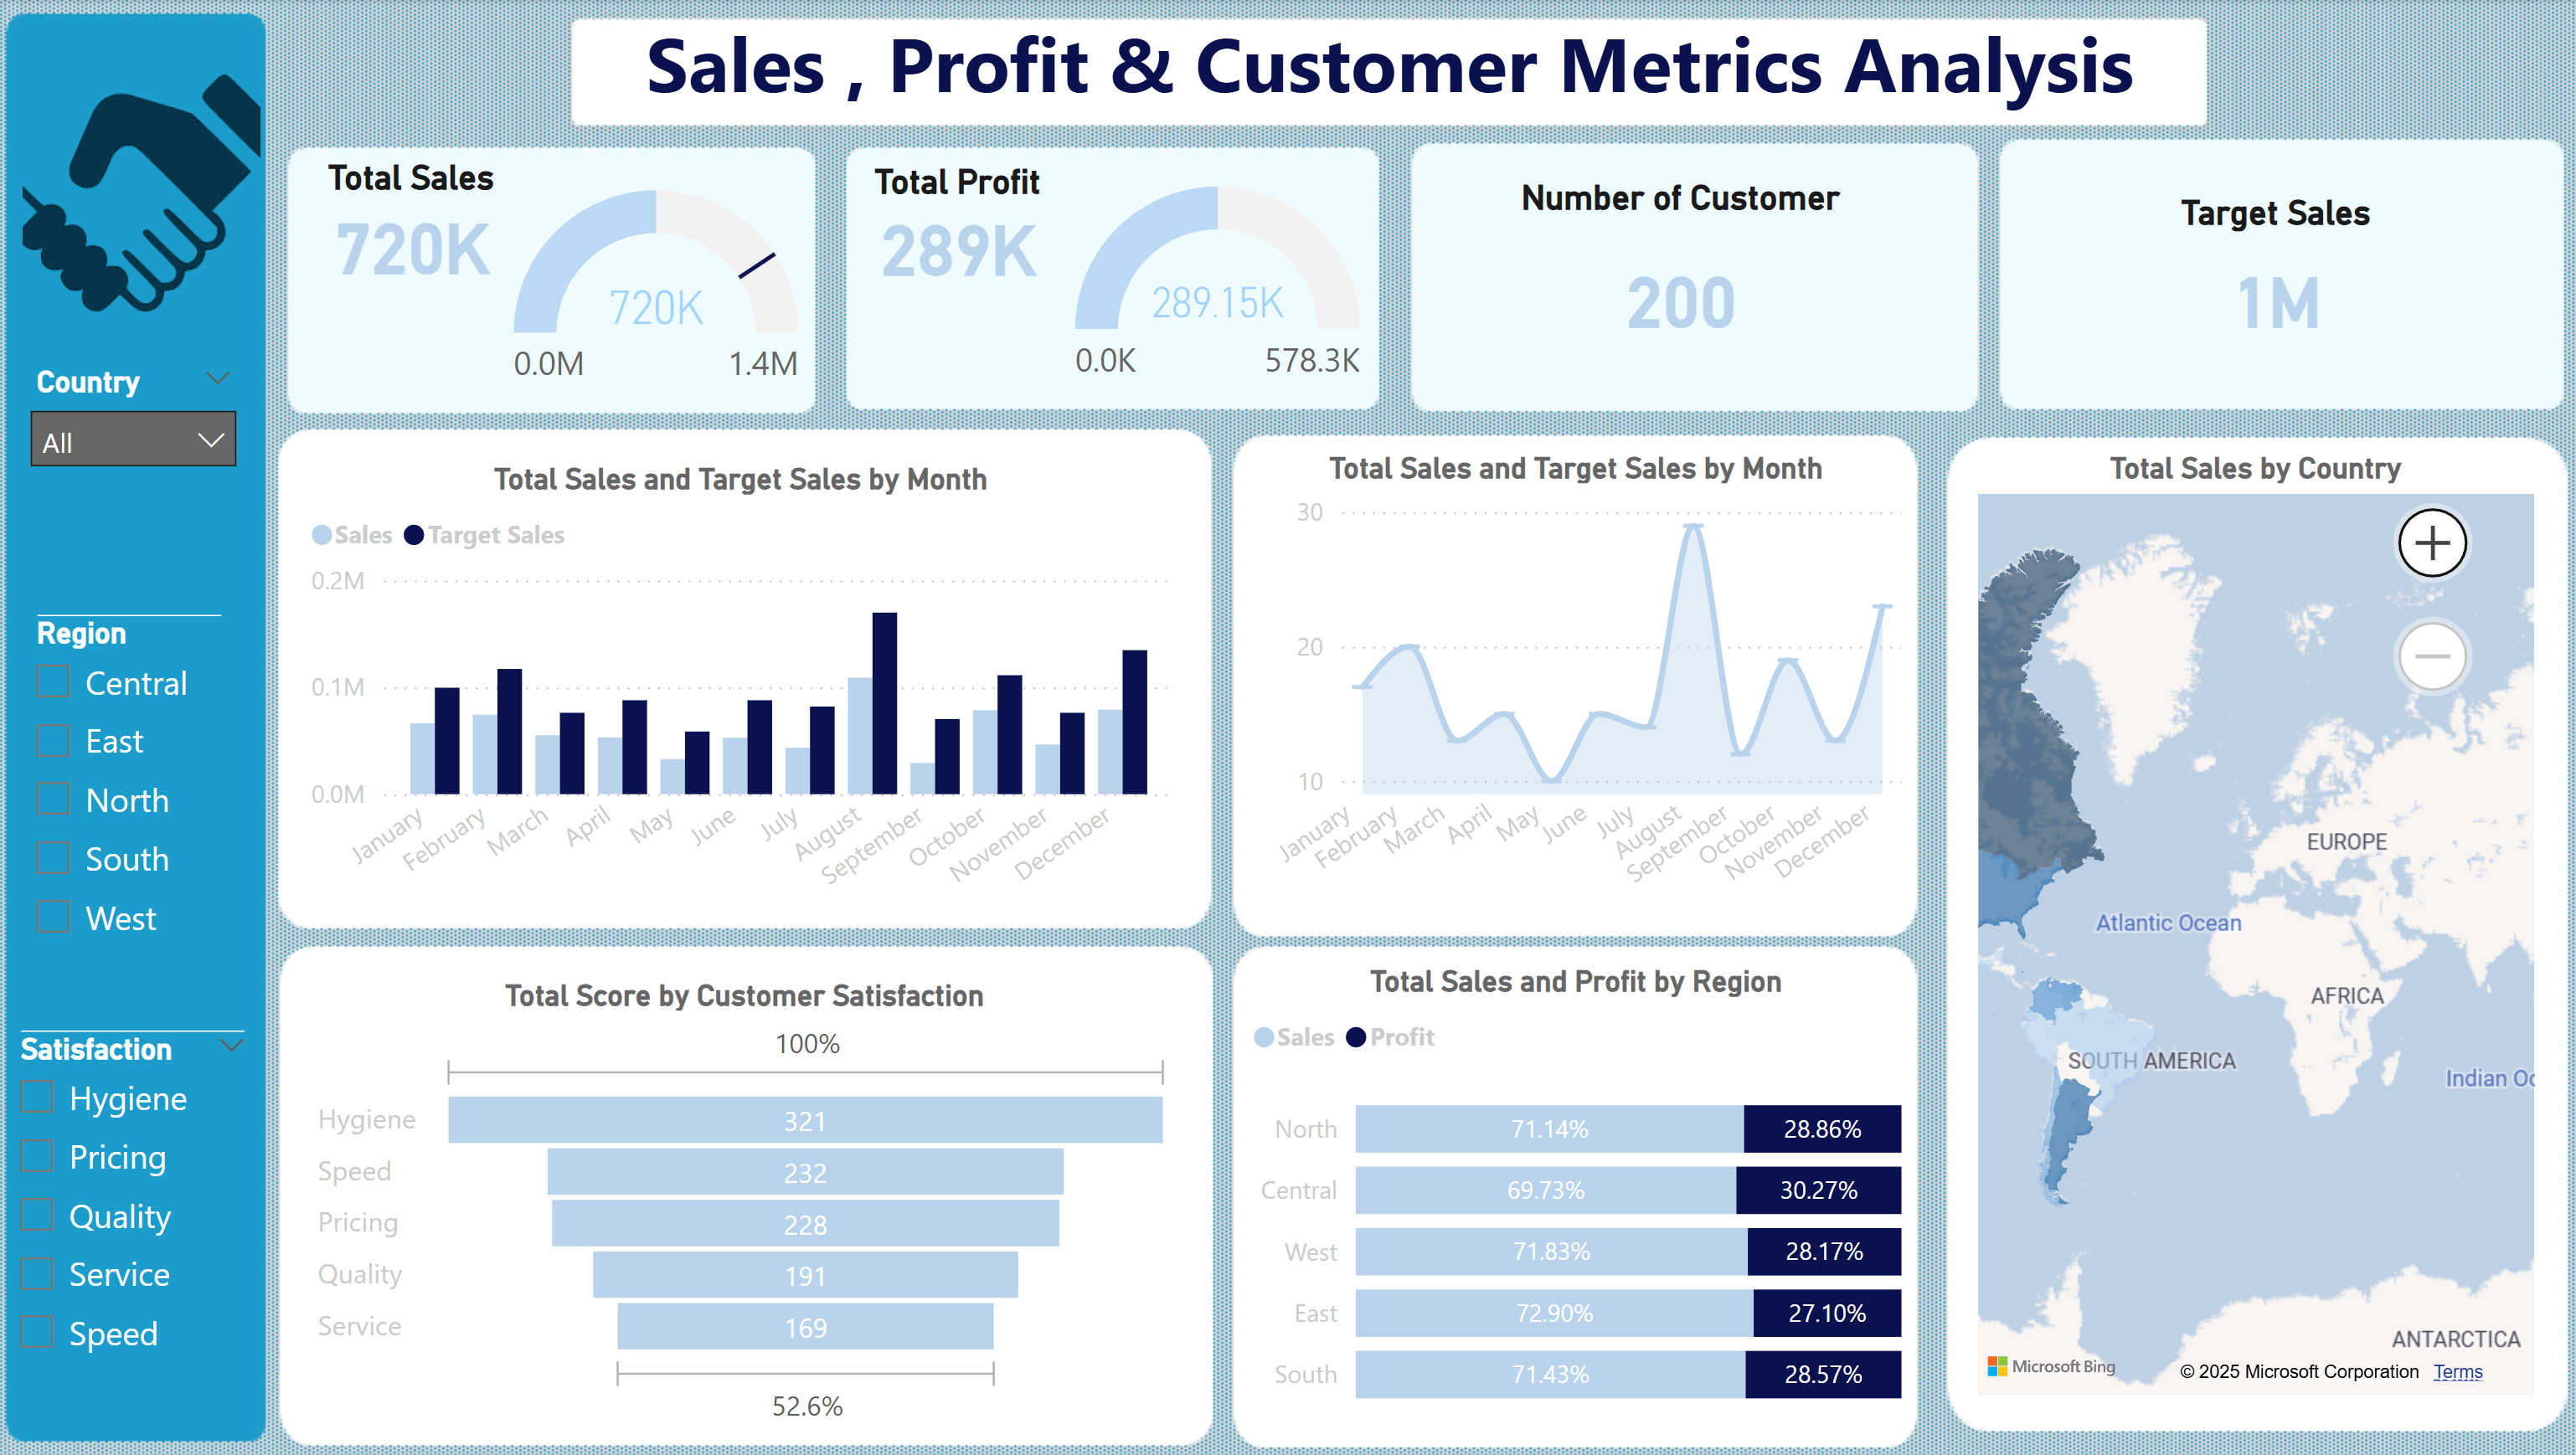
Insights & Use Cases
- Helps identify top-performing regions and customer behavior trends over time.
- Assists in tracking progress toward sales targets and profitability goals.
- Enables data-driven decision-making for regional marketing strategies.
- Highlights customer satisfaction areas that need improvement.
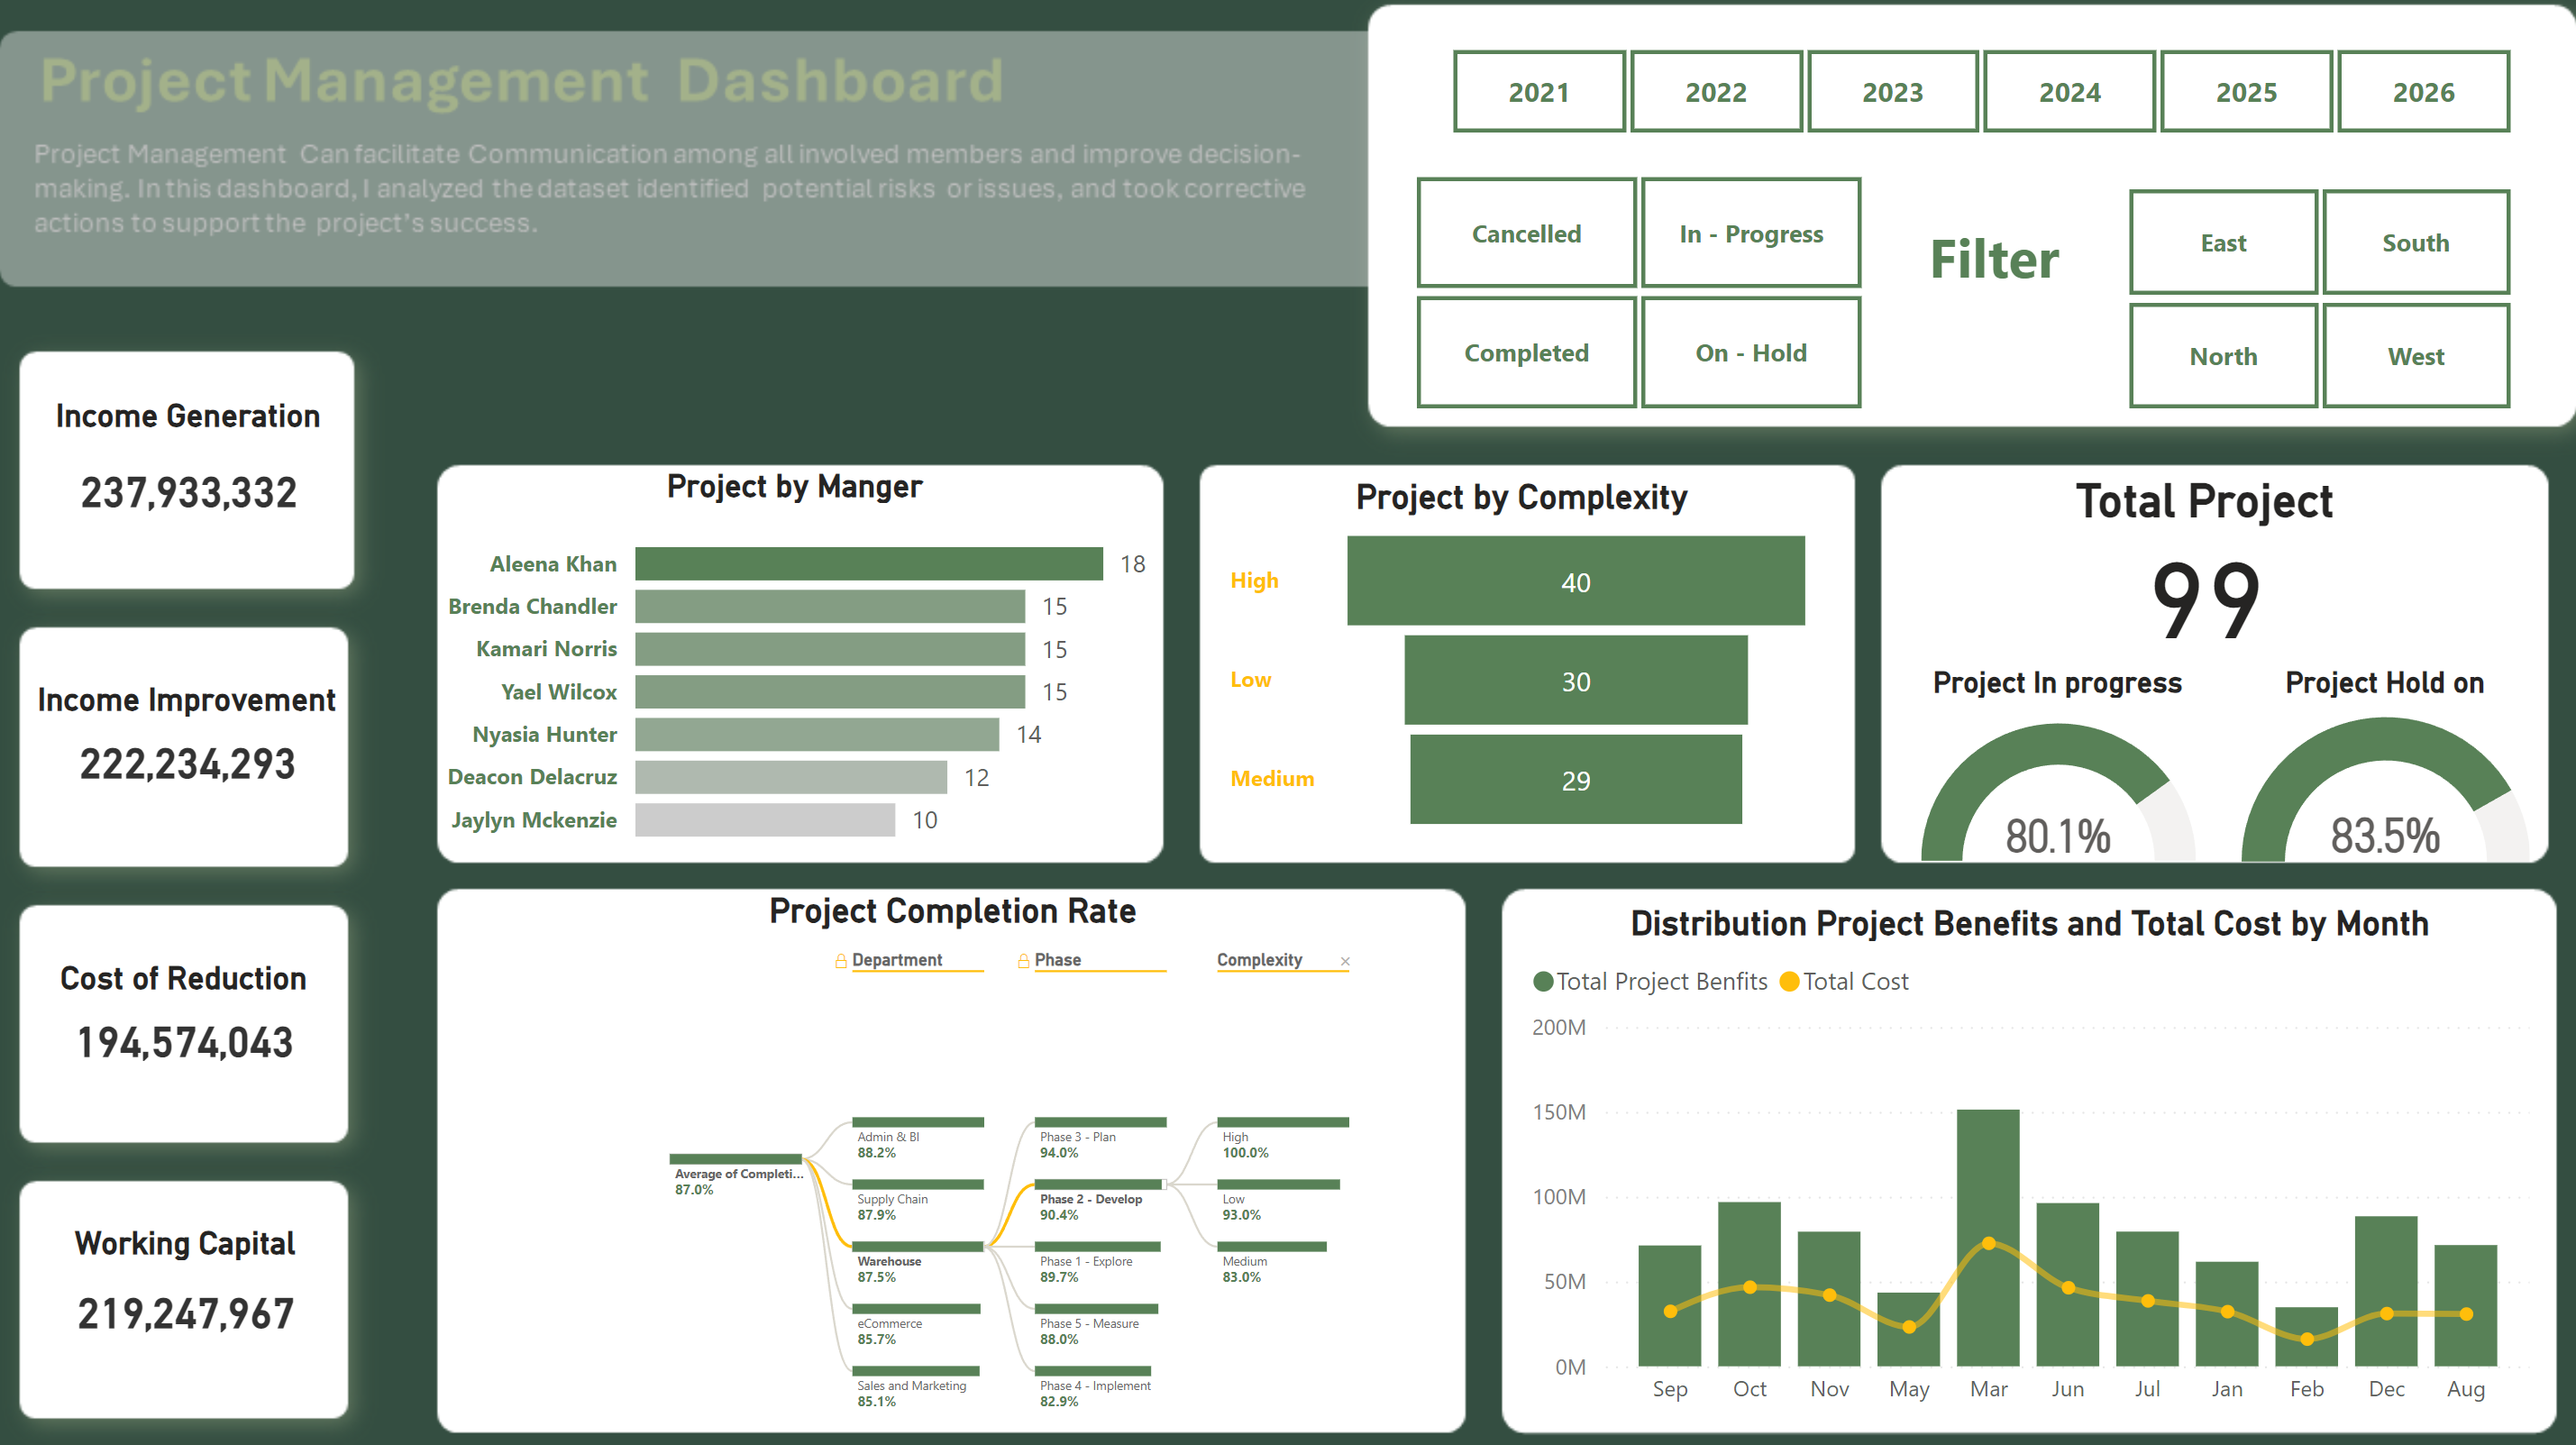
🌟 Project Management Dashboard – Driving Success through Insights 🌟
This project management dashboard provides insights into the performance and progress of various projects. It is designed to facilitate communication, enhance decision-making, and track key performance metrics effectively.
Key Insights
- 💼 Income Generation: Projects have generated a total of $237.93 million, showcasing their impact on driving revenue.
- 📈 Process Improvement: Delivered an income improvement of $222.23 million, reflecting the efficiency of optimization initiatives.
- 💰 Working Capital Enhancement: Achieved a working capital improvement of $219.25 million, strengthening financial resilience.
- 💡 Cost Reduction: Realized total savings of $411.51 million, highlighting effective resource utilization.
Project Complexity
- High Complexity: 40 projects
- Medium Complexity: 29 projects
- Low Complexity: 30 projects
Performance Highlights
- ✅ Average Completion Rate: 87%, demonstrating strong progress and timely execution.
- 📊 Project Status:
- In Progress: 25.3%
- On Hold: 17.2%
Tools & Technologies
- Tools Used: Tableau, Excel
- Technologies: Data visualization, project management analytics
About the Dashboard
This dashboard was created to analyze a dataset of project management performance. It identifies potential risks, highlights project complexities, and tracks progress to ensure the success of each initiative.
Feel free to connect if you’d like to know more about this project or discuss how dashboards can transform your decision-making process!
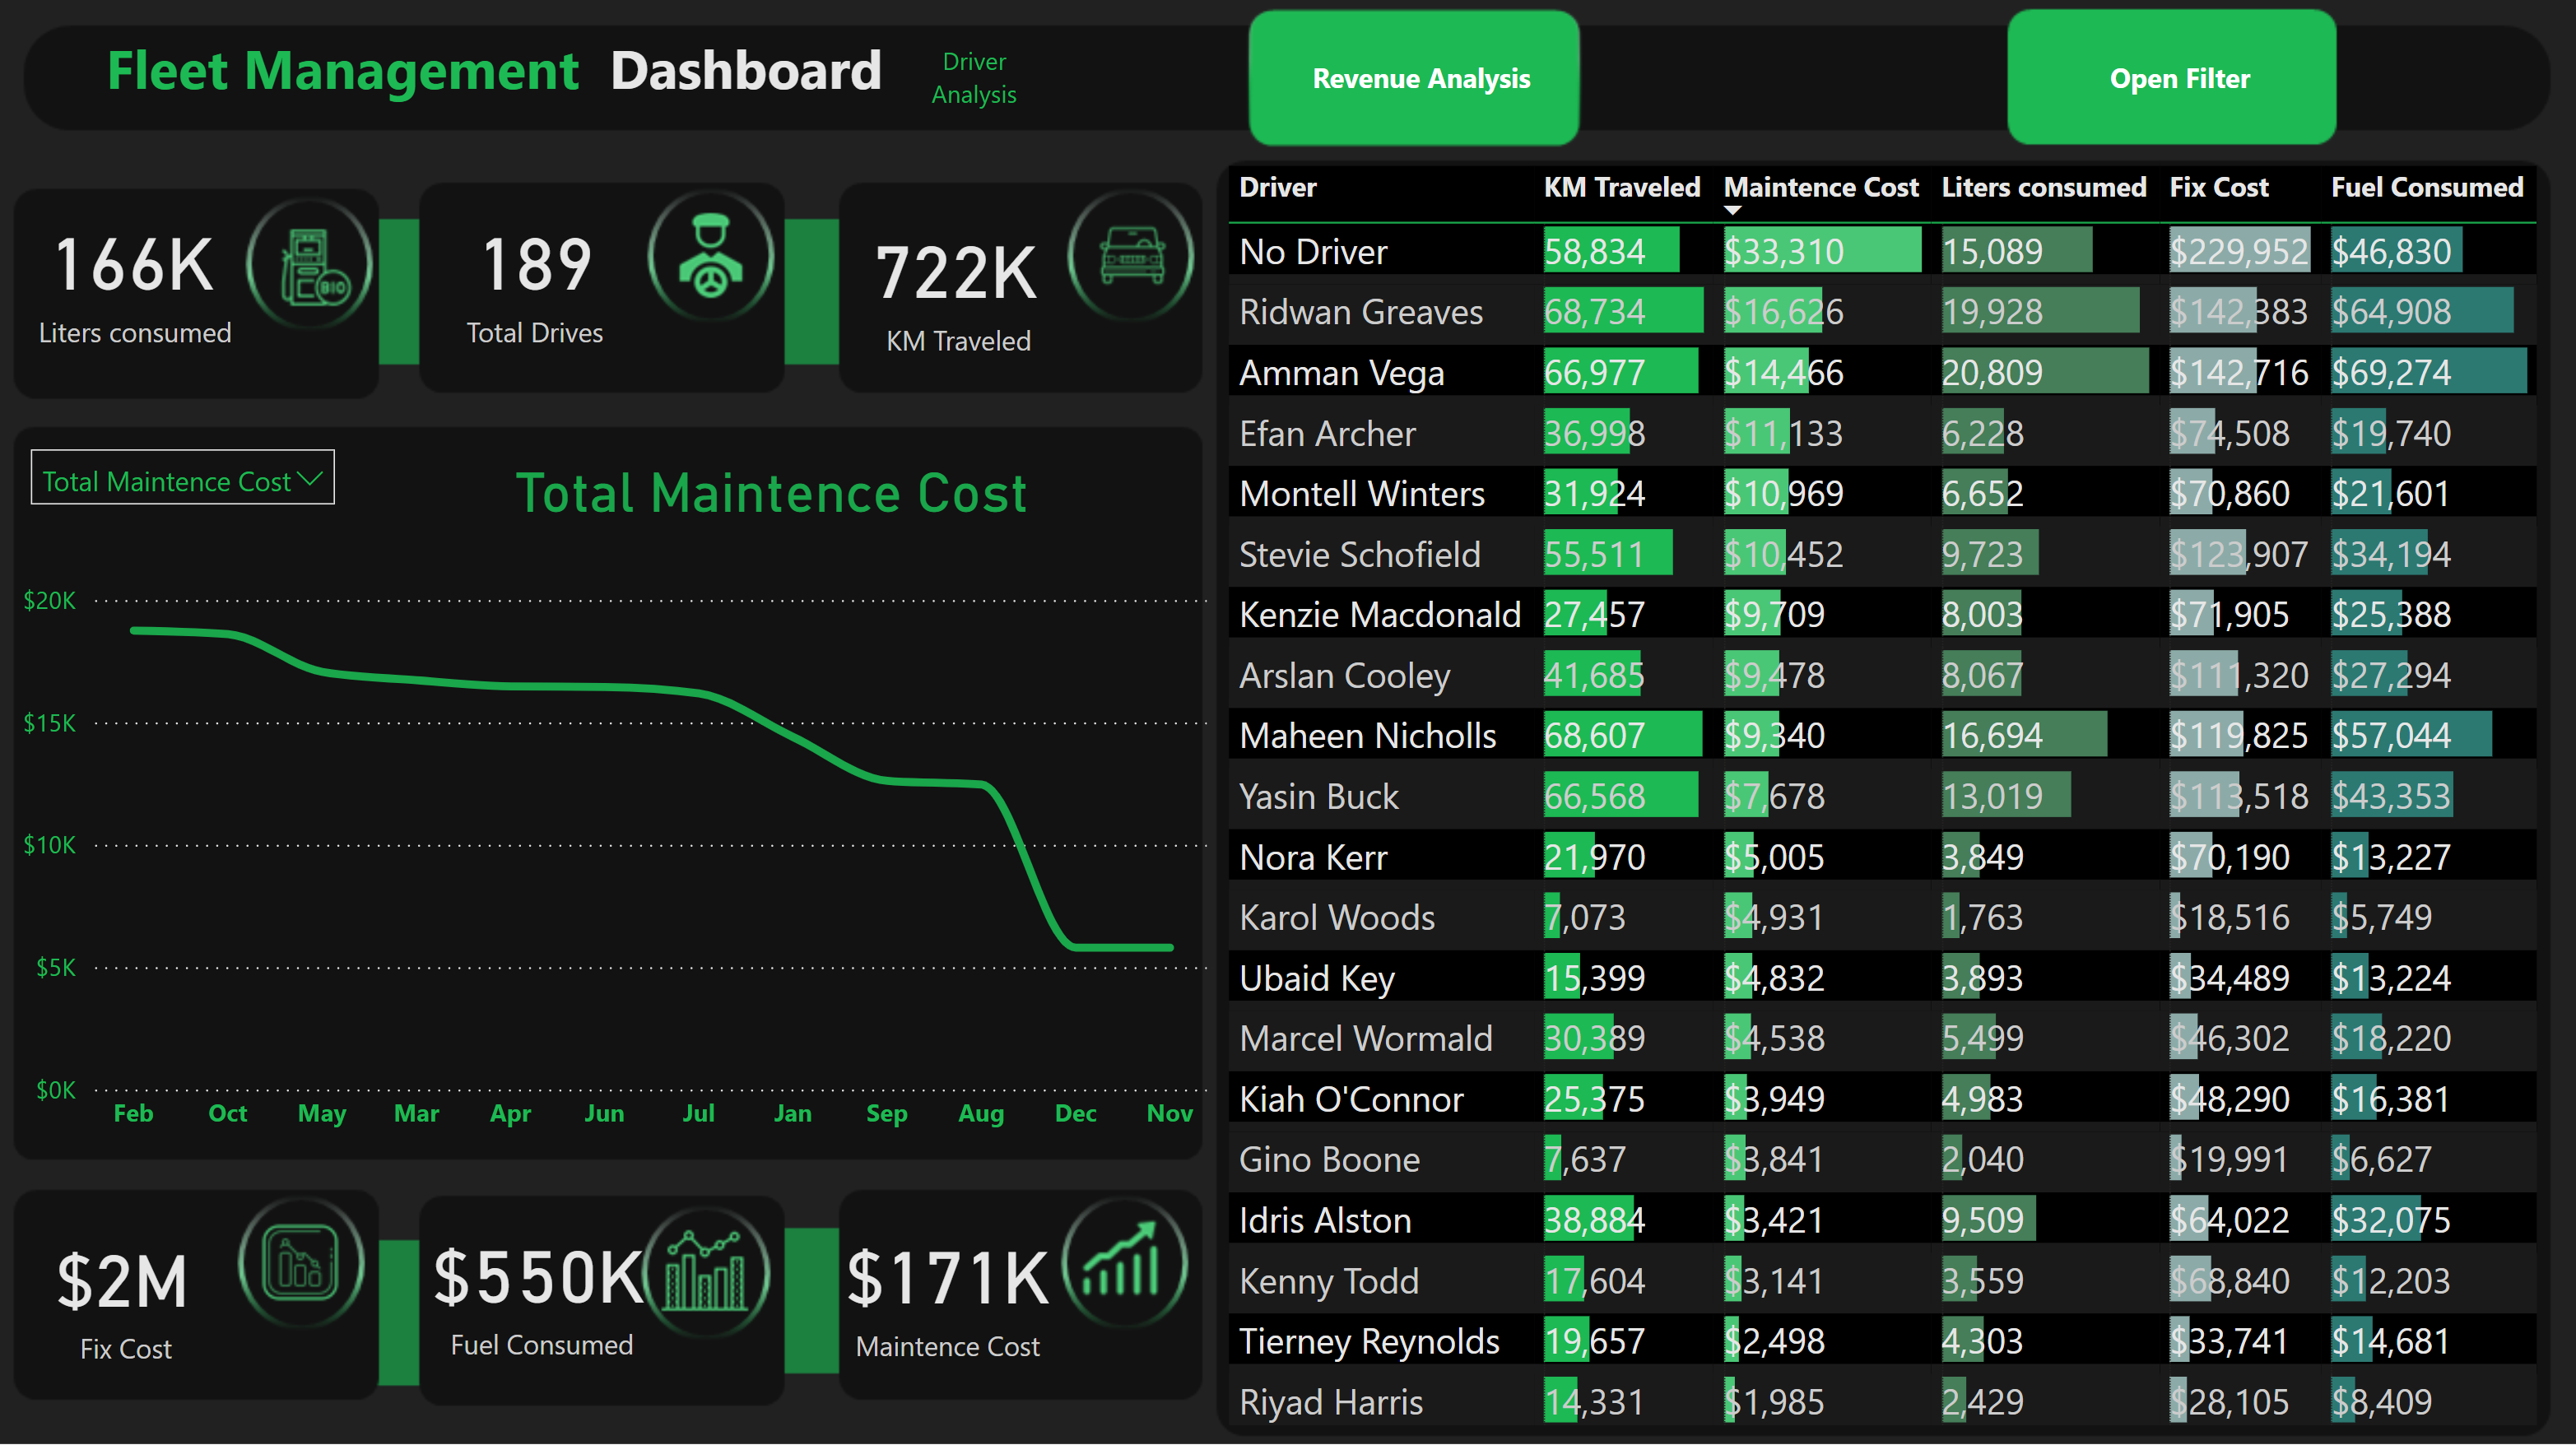
Fleet Management Dashboard | Link
To improve customer retention, focus on several key strategies. Implement loyalty programs and personalized communication to encourage repeat purchases.
Leverage purchase patterns for upselling and cross-selling opportunities, increasing average order value. Engage with customers regularly through email campaigns, newsletters, or social media to keep them informed about new products and promotions.
Encourage customers to leave feedback and reviews, which can attract new customers and boost loyalty. Segment customers based on their purchase history for targeted marketing campaigns with personalized promotions.
Analyze the customer journey to identify and improve any pain points. Provide excellent customer support to promptly address any issues or concerns.
Implement referral programs, offering incentives for successful referrals to expand the customer base. Conduct competitor analysis to understand why customers choose your business over others and enhance your offerings accordingly.
By focusing on these strategies, the business can build a loyal customer base and achieve long-term growth and success.
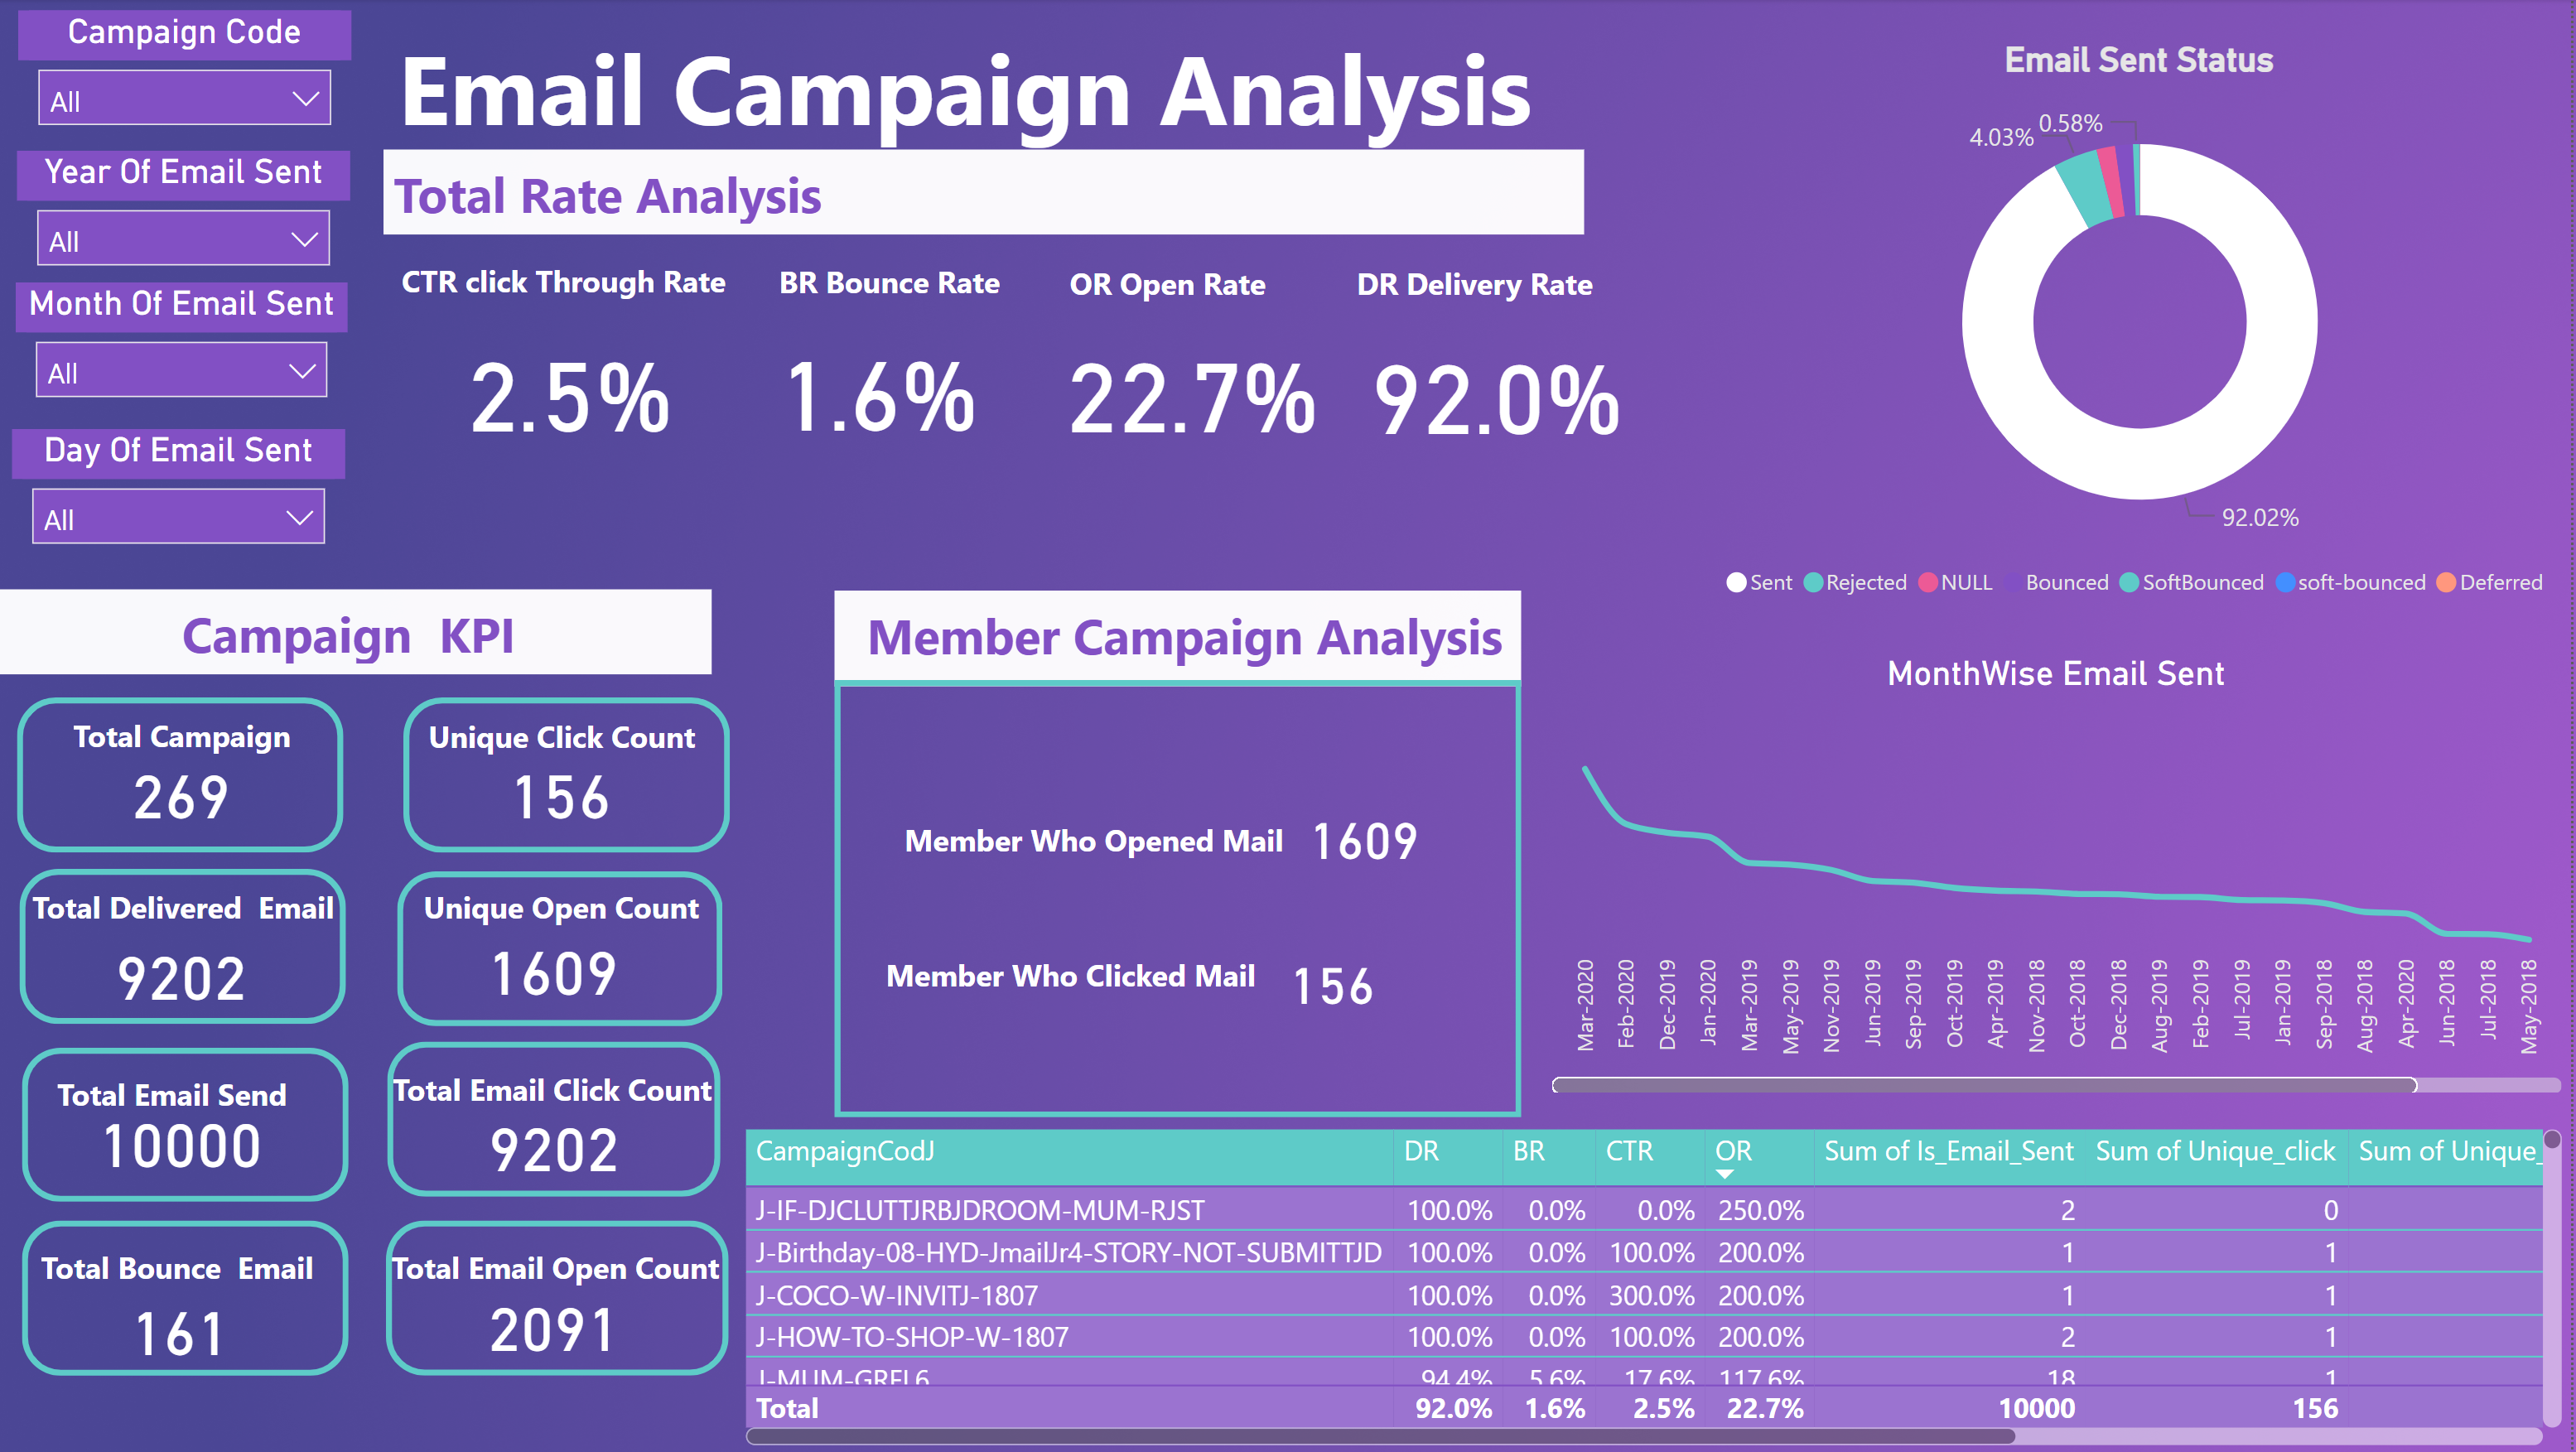
Analyzing email marketing performance | Link
KPIs
- Open Rate: This metric measures the percentage of recipients who opened your email.
- Click-Through Rate (CTR): CTR measures the percentage of recipients who clicked on a link or call-to-action within your email.
- Bounce Rate: Bounce rate indicates the percentage of emails that were not successfully delivered to recipients’ inboxes.
- Time and Day of Sending: Analyzing the performance of your emails based on the time and day they were sent can help identify the optimal send times for your audience.